Quick answer
A bill with solar shows what you bought from the grid, what you exported and were credited for, and a fixed daily supply charge. Reading those three lines together tells you whether your solar is being used well, and whether a battery, a habit change or a different plan would help.
What are the main lines on the bill?
Most retailers lay bills out differently, but the same items appear on all of them:
- Usage or consumption. The kilowatt-hours (kWh) you bought from the grid, with the price per kWh. On time-of-use plans this is split into peak, shoulder and off-peak.
- Solar feed-in or exports. The kWh you sent to the grid and the credit you earned.
- Daily supply charge. A fixed cost for each day you are connected.
- Discounts, concessions and GST. These vary by plan and household.
Why can't I see my solar production on the bill?
Your meter measures what flows between your home and the grid. When your solar powers the kettle directly, that power never crosses the meter, so the bill does not show it. To see total production and how much your home used directly, open your inverter or battery app.
How do I tell if my solar is being used well?
Put the export figure next to the usage figure:
- High exports, high usage. You make plenty of solar but use most of your power when the sun is down. Moving use into the day or adding a battery usually helps most.
- Low exports, high usage. Your home uses most of what the panels make, but needs more. A bigger system might help, roof and network limits allowing.
- Low exports, low usage. Your system is well matched to your home.
What does time-of-use pricing mean for me?
On a time-of-use plan, power bought at peak times costs more. Solar helps during the day, but peak periods often run into the evening. A battery that discharges during the peak can be worth more on these plans. Check your plan's peak hours on the bill or the retailer's website.
What should I check when comparing plans?
Compare the whole picture, not one rate: the usage prices, the supply charge and the feed-in rate together, applied to your own usage and exports. A plan with a high feed-in rate can still cost more overall if its usage or supply charges are higher.
A real example
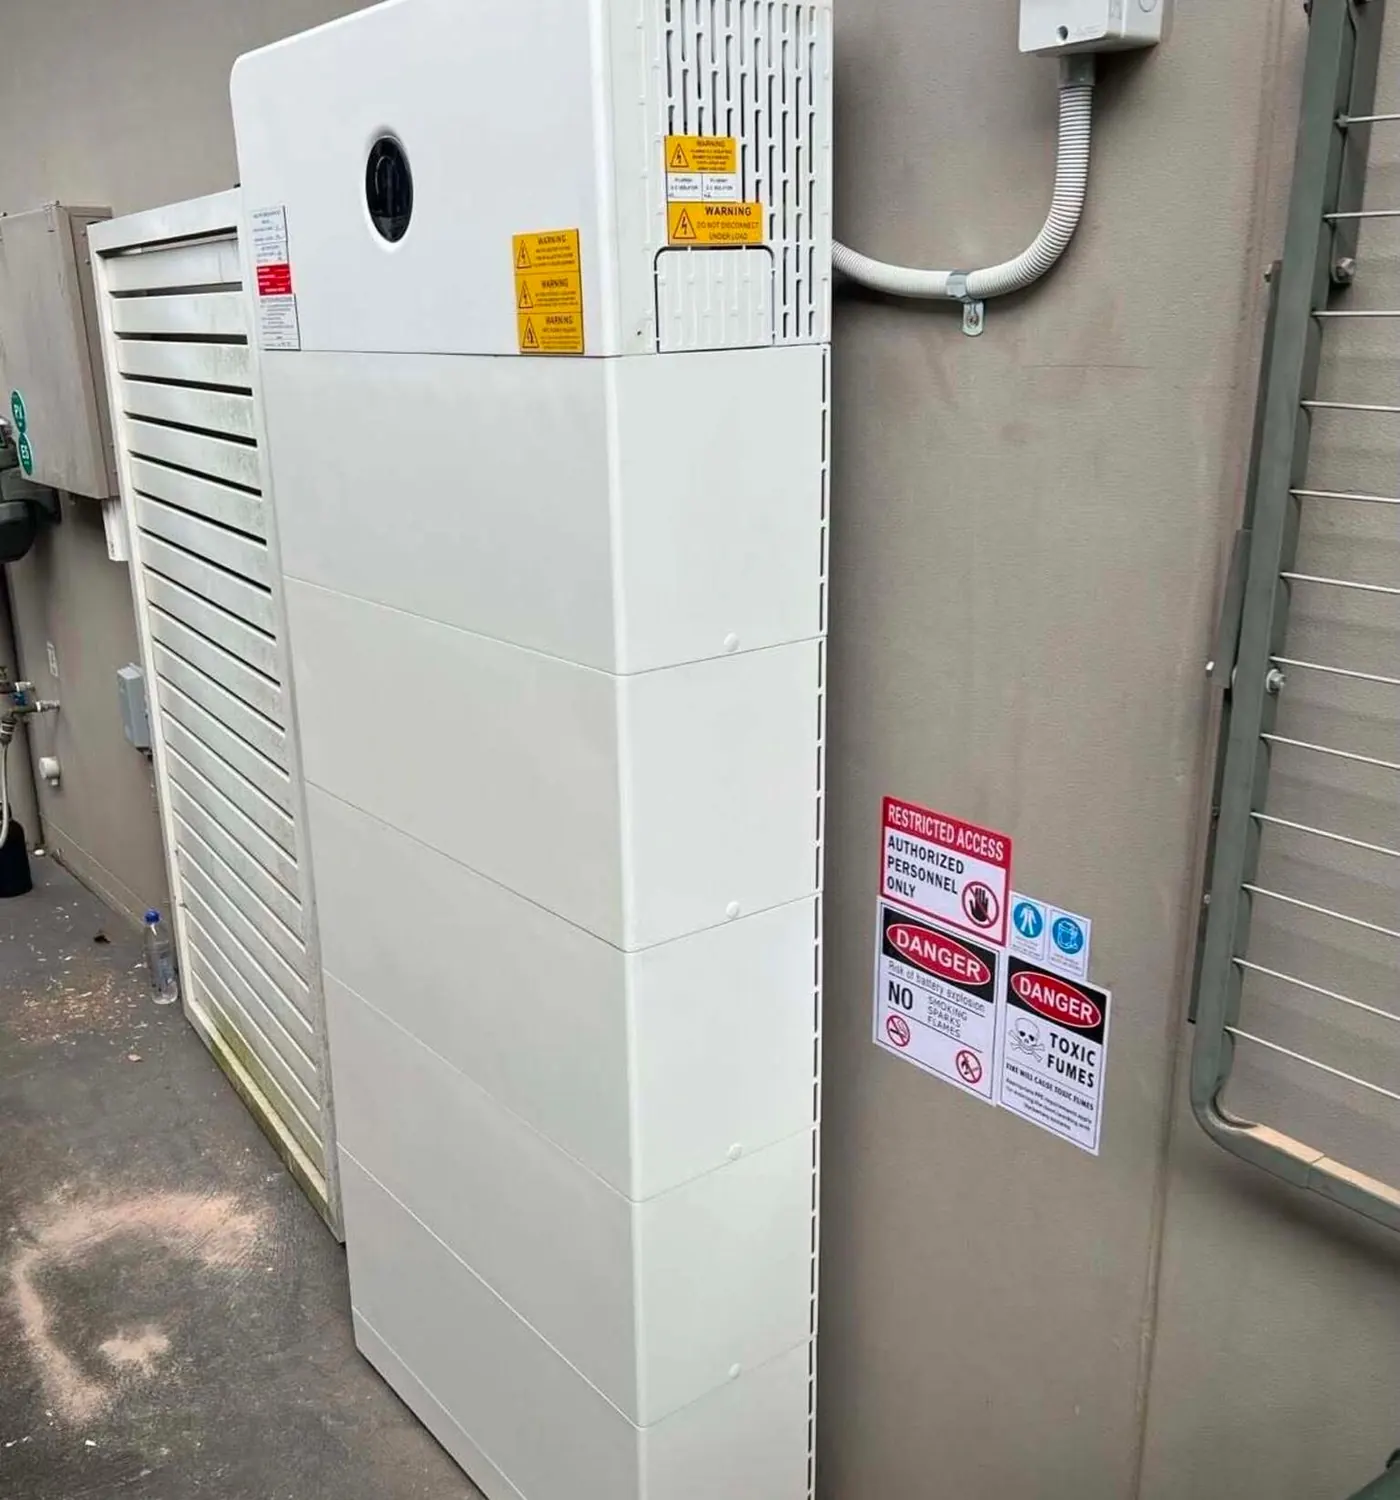
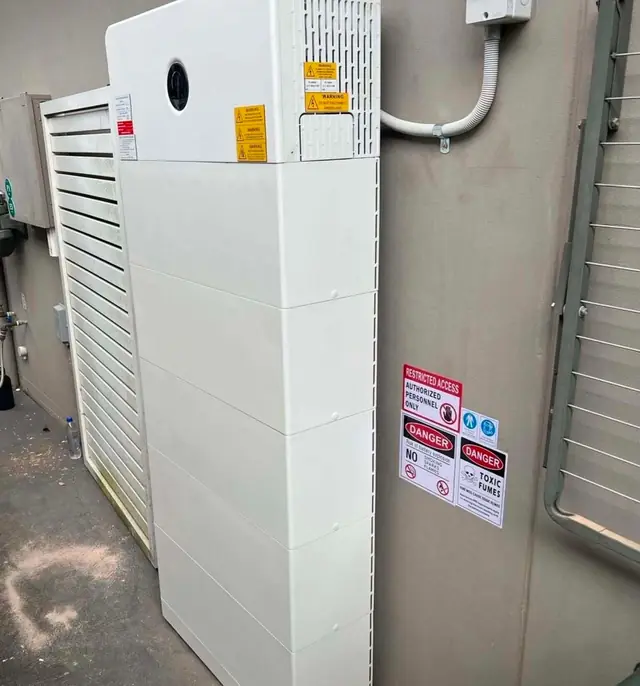
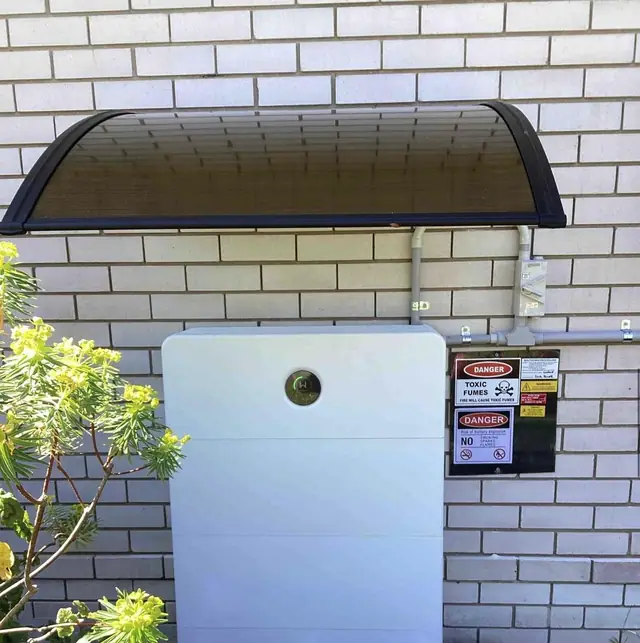
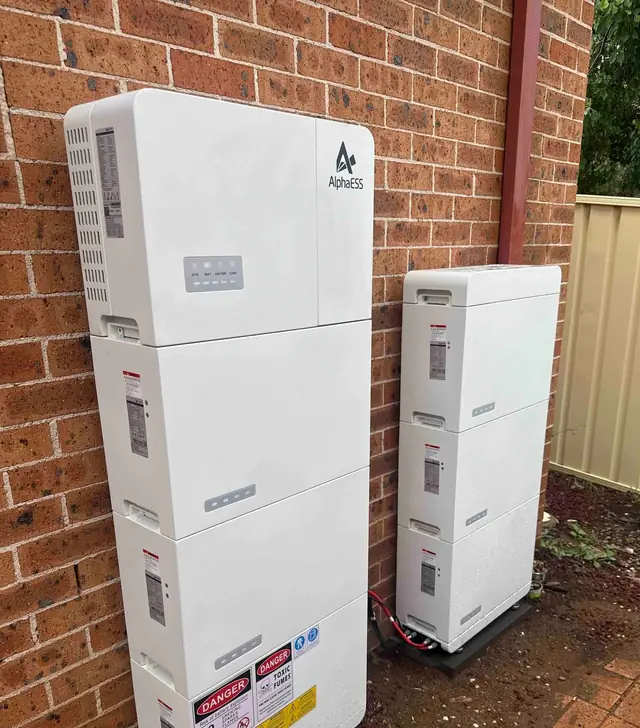
We installed 11 kW of Jinko panels with a 33 kWh GoodWe battery in Concord West. When owners send us bills like theirs, we look at the export and usage lines side by side; it shows straight away how much daytime solar is going out and how much evening power is coming in.
Want a second opinion?
Send us a recent bill with your request for a proposal. We will tell you what it shows about your usage and your system, and whether anything is worth changing.
Written by the Panda Power team from our own installs and the questions customers ask us.